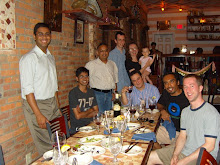
Saturday, April 19, 2008
Research Seminar Presentations
Microscopy Image Analysis for Phenotyping Studies - Kishore Mosaliganti (link)
Deriving Biological Insights: Optical Sectioning Microscopy - Shantanu Singh (link)
Diffusion Tensor Imaging Research - Okan Irfanoglu (link)
fMRI Analysis: Methods and Challenges - Firdaus Janoos (link)
These presentations were meant to give an overview of research in our group and present some open problems to the audience.
Friday, February 8, 2008
Expectation Maximization
We will continue the discussion next week when we will discuss the incremental version of EM [2] and revisit Kilian Pohl's work.
[1] Minka, T. (1998). Expectation-Maximization as lower bound maximization. Tutorial published on the web at http://www-white.media.mit.edu/ tpminka /papers/em.html.
[2] Neal, R. M. and Hinton, G. E. 1999. A view of the EM algorithm that justifies incremental, sparse, and other variants. In Learning in Graphical Models, M. I. Jordan, Ed. MIT Press, Cambridge, MA, 355-368.
[3] Arthur Dempster, Nan Laird, and Donald Rubin. "Maximum likelihood from incomplete data via the EM algorithm". Journal of the Royal Statistical Society, Series B, 39(1):1–38, 1977
Tuesday, December 4, 2007
Possible topics for Winter 888
"Roughly speaking a stochastic process is a generalization of a probability distribution (which describes a finite-dimensional random variable) to functions. By focussing on processes which are Gaussian, it turns out that the computations required for inference and learning become relatively easy. Thus, the supervised learning problems in machine learning which can be thought of as learning a function from examples can be cast directly into the Gaussian
process framework."
The book is online.
"Graphical models are a marriage between probability theory and graph theory. They provide a natural tool for dealing with two problems that occur throughout applied mathematics and engineering -- uncertainty and complexity -- and in particular they are playing an increasingly important role in the design and analysis of machine learning algorithms. Fundamental to the idea of a graphical model is the notion of modularity -- a complex system is built by combining simpler parts. Probability theory provides the glue whereby the parts are combined, ensuring that the system as a whole is consistent, and providing ways to interface models to data. The graph theoretic side of graphical models provides both an intuitively appealing interface by which humans can model highly-interacting sets of variables as well as a data structure that lends itself naturally to the design of efficient general-purpose algorithms.
Many of the classical multivariate probabalistic systems studied in fields such as statistics, systems engineering, information theory, pattern recognition and statistical mechanics are special cases of the general graphical model formalism -- examples include mixture models, factor analysis, hidden Markov models, Kalman filters and Ising models. The graphical model framework provides a way to view all of these systems as instances of a common underlying formalism. This view has many advantages -- in particular, specialized techniques that have been developed in one field can be transferred between research communities and exploited more widely. Moreover, the graphical model formalism provides a natural framework for the design of new systems." --- Michael Jordan, 1998.


